Visualising Macrobond data as maps using Python
You already know how to visualise Macrobond’s wealth of macroeconomic and financial aggregate data using a variety of line, bar and other charts.
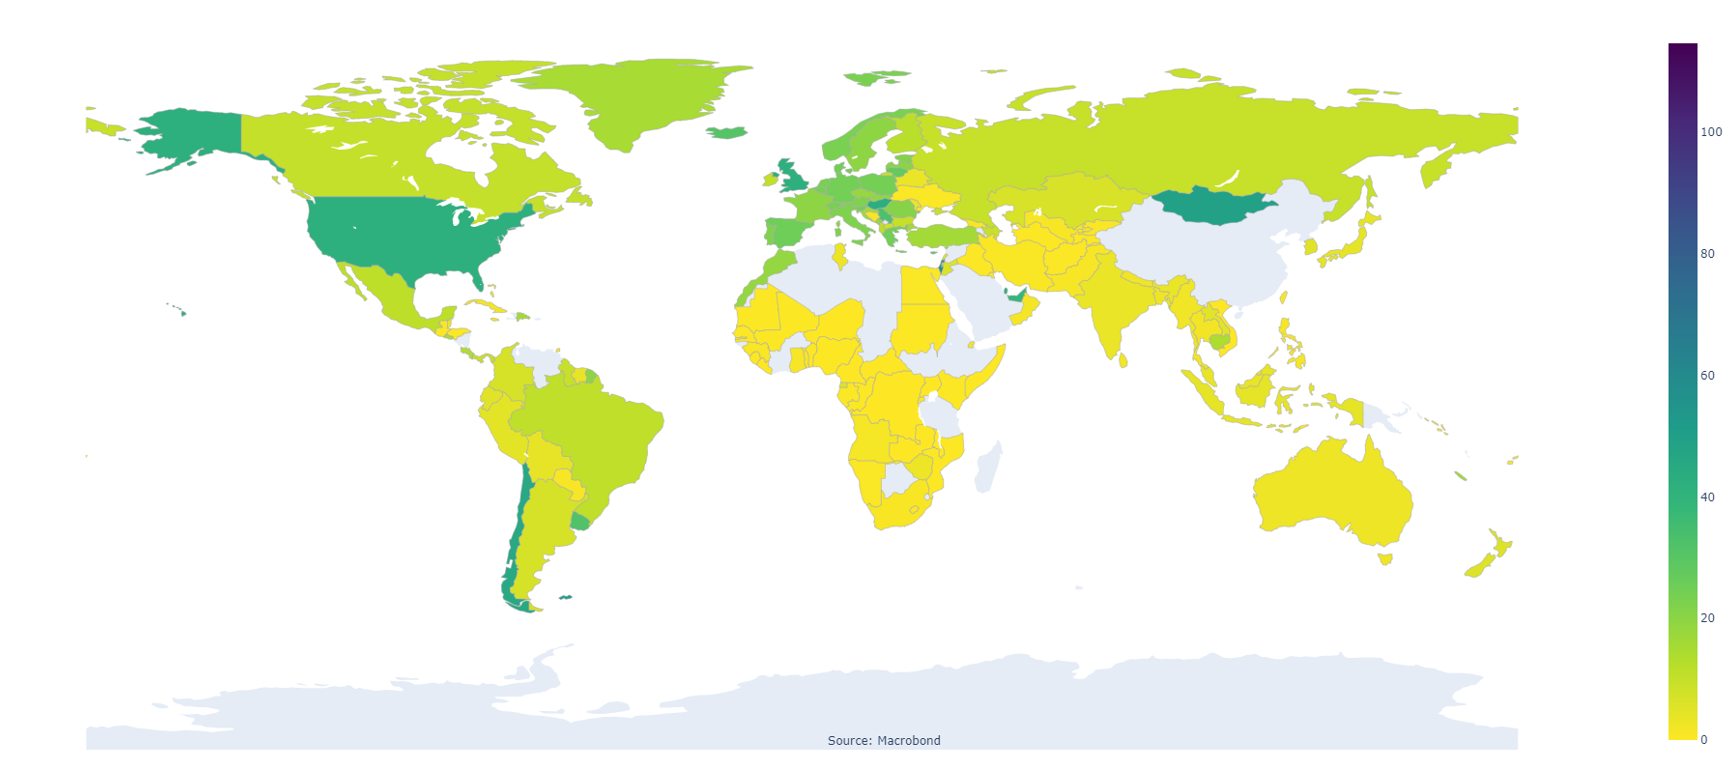
But did you know you can also use it to create geographic heat map like this one below in just a few steps?
Our World in Data, COVID-19, Vaccinations, People Fully Vaccinated Per Hundred

Step 1: Find the same variable for several countries. Use the search functionality in the Macrobond API for a specific concept. Find this under “Time Series information” in the application or by accessing the metadata in Python. In this example we use a time series of Covid vaccinations and access that region key.
import win32com.client
import pandas as pd
c = win32com.client.Dispatch("Macrobond.Connection")
d = c.Database
Getting the region key/concept
s = d.FetchOneSeries("owidvacci_ar_pfvph")
key = s.Metadata.GetFirstValue("RegionKey") #Getting the region key of a series
regionkey = d.FetchOneEntity(key)
regionkeydesc =regionkey.Metadata.GetFirstValue("Description") #Getting the full name of the region key
regionkeydesc
Step 2: After finding the region key, use it to perform your search.
Searching for all series with the region key/concept
query = d.CreateSearchQuery()
query.SetEntityTypeFilter("TimeSeries")
query.AddAttributeValueFilter("RegionKey", key)
result = d.Search(query).Entities
Step 3: After receiving the search result, get the relevant metadata for constructing the map. In this example, we used the last value of the series, the region name and the ISO 3 code for the country.
Getting the last value and the region of the series via the metadata
val = pd.DataFrame(columns=['value'])
region = pd.DataFrame(columns=['region'])
for s in result:
region=region.append({'region': s.Metadata.GetFirstValue("Region")},ignore_index=True)
val= val.append({'value':s.Metadata.GetFirstValue("LastValue")}, ignore_index=True)
Translating the region code to ISO 3 and accessing the full name of the country
li=region.values.tolist()
iso = pd.DataFrame(columns=['iso'])
country = pd.DataFrame(columns=['country'])
entities = d.FetchEntities(li)
for e in entities:
iso= iso.append({'iso':e.Metadata.GetFirstValue("IsoCountryCode3")}, ignore_index=True)
country=country.append({'country': e.Metadata.GetFirstValue("Description")},ignore_index=True)
Step 4: Merge this data into the same data frame.
Merging the ISO3, Country name, Region and Values into one
df = pd.merge(iso, country, left_index=True, right_index=True)
df=pd.merge(df, region, left_index=True, right_index=True)
df=pd.merge(df, val, left_index=True, right_index=True)
df['iso'] = df['iso'].str.upper() # Making sure that the data is inupper cases
Step 5: Once you have the data, use plotly to createthe map.
import plotly.graph_objects as go
fig = go.Figure(data=go.Choropleth(
locations = df['iso'],
z = df['value'],
text = df['country'],
colorscale = 'viridis',
autocolorscale=False,
reversescale=True,
marker_line_color='darkgray',
marker_line_width=0.5,
colorbar_title = '',
))
Adding a dynamic title and sourcing
fig.update_layout(
title_text=regionkeydesc,
geo=dict(
showframe=False,
showcoastlines=False,
projection_type='equirectangular'
),
annotations = [dict(
x=0.55,
y=0.00001,
xref='paper',
yref='paper',
text='Source: <ahref="https://www.macrobond.com/">Macrobond</a>',
showarrow = False
)]
Here’s the full script:
import plotly.express as px
import win32com.client
import pandas as pd
c = win32com.client.Dispatch("Macrobond.Connection")
d = c.Database
Getting the region key
s = d.FetchOneSeries("owidvacci_ar_pfvph")
key = s.Metadata.GetFirstValue("RegionKey") #Getting theregion key of a series
regionkey = d.FetchOneEntity(key)
regionkeydesc = regionkey.Metadata.GetFirstValue("Description")#Getting the full name of the concept
regionkeydesc
Searching for all series with the region key/concept
query = d.CreateSearchQuery()
query.SetEntityTypeFilter("TimeSeries")
query.AddAttributeValueFilter("RegionKey", key)
result = d.Search(query).Entities
Getting the last value and the region of the series via the metadata
val = pd.DataFrame(columns=['value'])
region = pd.DataFrame(columns=['region'])
for s in result:
region= region.append({'region':s.Metadata.GetFirstValue("Region")}, ignore_index=True)
val= val.append({'value':s.Metadata.GetFirstValue("LastValue")}, ignore_index=True)
Translating the region code to ISO 3 and accessing the full name of thecountry
li=region.values.tolist()
iso = pd.DataFrame(columns=['iso'])
country = pd.DataFrame(columns=['country'])
entities = d.FetchEntities(li)
for e in entities:
iso= iso.append({'iso':e.Metadata.GetFirstValue("IsoCountryCode3")}, ignore_index=True)
country=country.append({'country': e.Metadata.GetFirstValue("Description")},ignore_index=True)
Merging the ISO3, Country name, Region and Values into one
df = pd.merge(iso, country, left_index=True, right_index=True)
df=pd.merge(df, region, left_index=True, right_index=True)
df=pd.merge(df, val, left_index=True, right_index=True)
df['iso'] = df['iso'].str.upper()
import plotly.graph_objects as go
fig = go.Figure(data=go.Choropleth(
locations = df['iso'],
z = df['value'],
text = df['country'],
colorscale = 'viridis',
autocolorscale=False,
reversescale=True,
marker_line_color='darkgray',
marker_line_width=0.5,
colorbar_title = '',
))
Adding a dynamic title and sourcing
fig.update_layout(
title_text=regionkeydesc,
geo=dict(
showframe=False,
showcoastlines=False,
projection_type='equirectangular'
),
annotations = [dict(
x=0.55,
y=0.00001,
xref='paper',
yref='paper',
text='Source: <ahref="https://www.macrobond.com/">Macrobond</a>',
showarrow = False
)]
)